Pillar 6 · Cluster 2
Compensation market intelligence
Salaries in GBS hubs are not random. They are shaped by market data, cost of labor, hub maturity, and competitive dynamics. Understanding how compensation is benchmarked gives you use in salary conversations.
Sound familiar?
Topic 01 · Salary Benchmarking
How salaries are determined in GBS hubs
Your salary is set by market data, internal bands, and budget cycles — not by what you feel you deserve. Learn the machinery. Read how to solve this in the section below!
Your salary was not chosen for you.
It was benchmarked.
 P
PPriya wonders why her raise came in at exactly 4% — again.
HR explains the machinery: market survey data, role band, position-in-range, annual budget pool.
Her number was never personal. It was a cell in a grid.
"I negotiated with feelings. The system runs on data."
She feels informed — and better armed.
You argue your worth against a system that only hears market data and band positions.
Three mechanisms set your number — all three are learnable.
Her next conversation names her band position and market reference. The system finally hears her in its own language.
How GBS salaries are determined — in depth
Your salary is not based on what you think you deserve. It is based on market data, internal equity bands, and what the organization needs to pay to attract and retain talent in your location.
Your pay is set by benchmarking, not by what your title sounds like.
- GBS organizations benchmark salaries using market data from providers like Mercer, Willis Towers Watson, Radford, and local salary surveys.
- The process matches your role (not your title — titles vary wildly across organizations) to a market equivalent, then positions your compensation at a target percentile: typically 50th for base, with variable pay bringing total rewards to 60th-75th percentile.
- Hub location, role scarcity, and competitive intensity all influence where the organization sets its pay ranges.
- Cost of labor — what the local market pays for comparable skills, driven by supply and demand dynamics
- Hub maturity — established hubs (Krakow, Manila, Bangalore) have mature labor markets with clear pay bands; newer hubs may pay premiums to attract talent
- Skill scarcity — roles requiring SAP, automation, or analytics expertise command premiums in hubs where these skills are scarce
- Industry concentration — hubs dominated by a few large GBS employers tend toward salary convergence; fragmented markets show more variation
- Currency and inflation — local inflation rates and currency fluctuations create year-over-year compensation volatility in global comparisons
Location differentials — US 1.0x, Poland 0.45x, India 0.35x
Ask HR one question: "Where am I in my band?" The answer changes your strategy.
Bands live in cities. And cities confuse two very different costs.
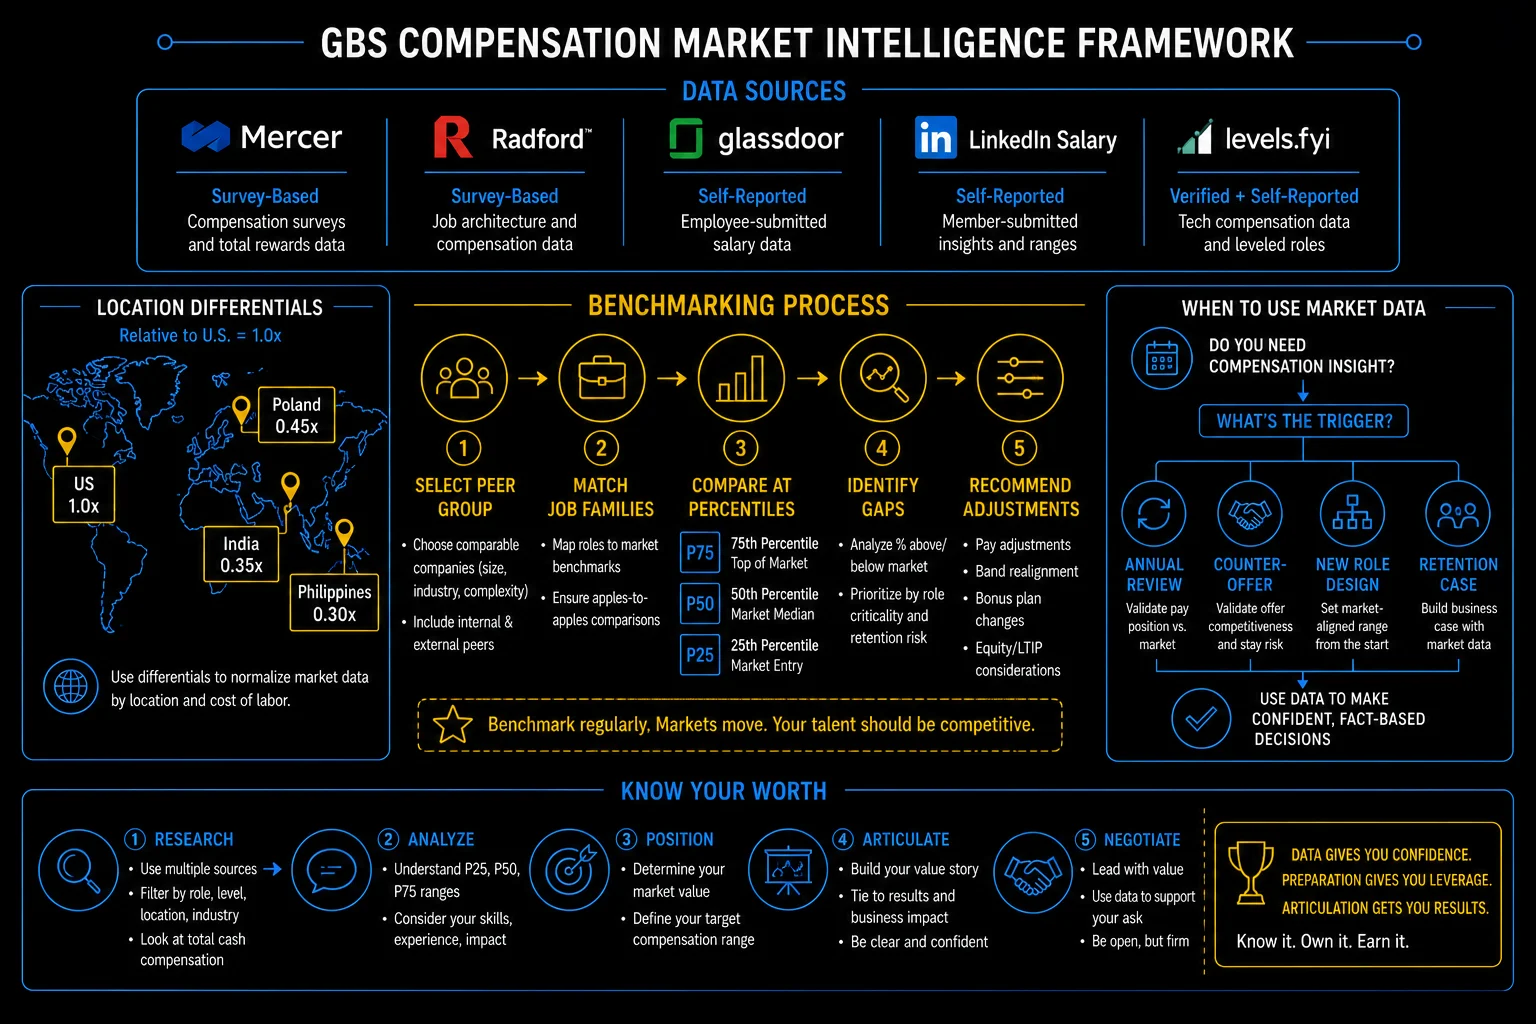
GBS compensation market intelligence: data sources, benchmarking process, and know your worth
Topic 02 · Cost Analysis
Cost of Living vs Cost of Labor
Cost of Living is what life costs you. Cost of Labor is what employers pay for talent. Salaries follow the second — not the first. Read how to solve this in the section below!
Your rent went up 15%.
Your band did not move.
 R
RRavi’s rent jumps. Groceries follow. His salary band: unchanged.
The frustration is real — and so is the mechanism.
Salaries track what employers must pay to hire in Pune, not what Pune costs Ravi this year.
"My expenses follow one curve. My salary follows a different one."
He feels frustrated — then starts watching the right curve.
You expect pay to track your expenses. It tracks the hiring market — a different number with a different clock.
Two curves, two different questions.
Ravi stops arguing inflation and starts building scarce skills. The second curve is the one he can actually push.
Cost of Living vs Cost of Labor in depth
These are not the same thing. Cost of Living tells you how expensive it is to live somewhere. Cost of Labor tells you how much it costs to employ someone there. GBS organizations care about the second one.
What it measures
- How much it costs an individual to maintain a standard of living
- Housing, food, transport, healthcare, education
- Used for expat packages and relocation allowances
- Varies within countries (Mumbai vs Pune, London vs Manchester)
What it measures
- How much it costs an employer to employ someone in a location
- Salary + benefits + taxes + social contributions + facilities
- Used for GBS hub location decisions and headcount planning
- Driven by labor market dynamics, not consumer prices
Check which of your skills appear most in local job postings. Scarcity there is your real raise engine.
Understand the curves — then bring the data to the table.
Topic 03 · Salary Negotiation
Using data to negotiate salary adjustments
Salary negotiation works when it is evidence-based: market data, internal comparables, documented impact — delivered at the right moment. Read how to solve this in the section below!
"I feel underpaid"
loses to a spreadsheet.
 K
KKlaudia’s first attempt, last year: "I feel my contribution deserves more." Sympathy, no raise.
This year: three market data points for her role and city, her band position, the brag sheet’s top five wins with numbers.
Delivered in February — before the budget locks.
"Here is the market, here is my impact, here is the gap."
She feels composed — and the tone across the table changes instantly.
You negotiate with feelings against a process that only moves on evidence and timing.
The case is three exhibits and a calendar.
The adjustment lands in the next cycle. Not because she asked harder — because she made refusing harder.
Data-driven salary negotiation in depth
Effective salary negotiation is evidence-based, not emotional. Bring market data, internal comparables, and a clear articulation of your value contribution.
- Gather market data from at least 3 sources — Glassdoor, LinkedIn Salary Insights, and industry-specific surveys
- Know your internal position — where you sit in the salary band relative to peers with similar experience and performance
- Quantify your contributions — link your impact to business outcomes (savings delivered, processes improved, SLAs maintained)
- Time it right — align salary discussions with performance review cycles, not random moments of frustration
- Have a BATNA — know what your alternatives are; credible use comes from actual options, not bluffs
Know your worth — research, analyze, position, articulate, negotiate
Collect two market data points for your role and city. Learn when your budget cycle locks.
Negotiation covers your desk. Cluster 3: when your desk crosses a border.
- Never walk into a salary conversation without data. Glassdoor, LinkedIn Salary, and peer conversations give you a range. "I believe I am below market" is weak. "Based on three data sources, the median for my role in this market is X, and I am at Y" is a negotiation.
- Location explains most of the pay variance in GBS, but not all of it. The person doing the same job in Mumbai and Budapest might have a 40% pay gap, and both might be fairly paid for their market. Compare within your market, not across markets.
Reference
Glossary
Full glossary at the GBS Insider Club Field Guide.
- Mercer — Total Remuneration Survey methodology, 2025
- Willis Towers Watson — Global Compensation Planning Survey, 2025
- SSON — GBS Hub Salary Benchmarking Report, 2025
- Glassdoor — Salary transparency and market data methodology
Knowing the frameworks is the entry ticket. Applying them — visibly, at your actual job — is what gets you promoted.
The GBS Insider Club Career Playbooks turn this theory into a guided 90-day program for your role: self-assessment, practical exercises, templates, and Julian's unfiltered practitioner playbook.
Explore the Career Playbooks → Back to Total Rewards